

 Completed
Portable ECG monitor based on STC15
PRO Portable ECG monitor based on STC15
License
:GPL 3.0
Description
//Uploaded a new version, it's time to do the graduation project, many people come to ask
Modification time: 2024.10.26

Requirements analysis
Feature introduction
-
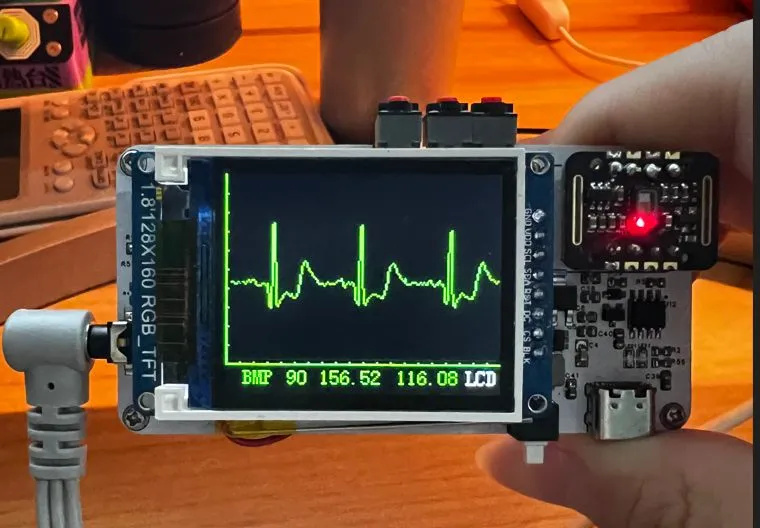
Display real-time electrocardiogram waveforms and calculate heart rate, and also measure blood oxygen saturation
-
Can switch the display of the lower computer screen or send waveform data to the upper computer via Bluetooth
-
Heart rate tachycardia, slow warning
Introduction to ECG signals
Introduction to electrocardiogram processing circuit
-
The first stage preamplifier has a gain of 7 and includes a right leg driver circuit to eliminate common mode interference
-
The second stage 107Hz low-pass filtering eliminates high-frequency signals
-
The third-stage dual-T active 50Hz notch filter filters out power frequency interference
-
Fourth stage 0.1Hz high-pass filtering, improve base line drift, amplify 50x
-
The fifth stage amplifier amplifies the signal 5 times
-
The overall signal was amplified 1250 times
Master
-
P54 pin low-level single-chip microcomputer reset, used for burning software
-
Using 3V3 power supply

Power supply
-
USB and lithium battery power supply
-
The USB interface has chosen the widely used TYPE-C
-
The battery is an 850mAh 3.7V lithium battery
-
After inserting the USB cable, it can automatically switch to USB power supply
-
Charge lithium batteries at the same time
-
Battery charging management uses the TP4056 chip

Software design

Heart rate calculation
Heart Rate (bpm) = 60/Mean R-Wave Interval (sec)
R wave detection method - threshold method
1. Traverse the data: Traverse each Data Point in the ECG data array.
2. Peak condition: For each Data Point, check whether it is greater than the adjacent Data Points on the left and right, and whether it exceeds the preset threshold.
3. Record peak: If the Data Point meets the above conditions, record its position to indicate that an R-wave peak has been detected.
Advantages: simple, fast
Cons: Imprecise, and the threshold needs to be manually observed, such as base line drift or noise glitches, which will have a great impact.

- Scaling the voltage value calculation to the Y-axis coordinate value of the screen pixel, with the X-axis as the time axis.
- One ADC value draws one pixel, and adjacent two points are connected by a straight line, resulting in real-time voltage waveform rolling refresh.

Blood oxygen saturation reading
Initialization: Initialize the MAX30102 sensor, including configuration mode, sampling rate, LED current and other parameters.
Data Acquisition: Read the intensity data of red and infrared light from the FIFO Data register of the sensor through I2C. Every three bytes of data needs to be merged and merged into a long integer.
3. Calculation: Use red light and infrared light data to calculate blood oxygen saturation through simplified formulas.
Simplified blood oxygen formula
-
R = red / ir
-
spO2 = 120 - 25 * R;
An accurate calculation method for blood oxygen saturation requires obtaining the DC and AC components of light intensity, which requires a large amount of calculation and storage of a large amount of data.
The results of simplifying the formula will not be very accurate.


Upper computer

Demo
Video link:
https://www.bilibili.com/video/BV1mJ8qeSEuj/?vd_source=51dc43e08b25c112cfd71690f421341d

Designed by olddogcai (from OSHWHub)
Link:https://oshwhub.com/olddogcai/ecg-monitor-based-on-stc8
Design Drawing
Intellectual Property Statement & Reproduction Instructions
This is an open-source hardware project. All intellectual property rights belong to the creator. The project is shared on the platform for learning, communication, and research only; any commercial use is prohibited. If your intellectual property rights are infringed on EasyEDA, please notify us by submitting relevant materials in accordance with the Rules for Complaints and Appeals of IPR Infringement.
Users must independently verify the circuit design and suitability when replicating this project. All risks and consequences are borne by the user, and the platform assumes no liability.
 Empty
Empty
Comment